Disclaimer: None of what follows is an actual trading advice. It was meant to educate and share my learning experience with the community, and should not be used as-is for making assumptions about the future direction of any market asset. Always do your own research!
In most domains of science (and I dare consider market technical analysis a form applied statistics/data science), serendipity plays an enormous role. Just the other day, I was playing around with the Stochastic Oscillator — a well-known TA indicator, trying to create an ML-driven trading strategy that beats Dollar-Cost-Averaging (DCA).
There is a popular belief that regularly investing small sums of money over a longer period of time (also known as Dollar-Cost-Averaging) is a relatively low-risk way of beating the market. I decided to try and use machine learning to beat DCA, by keeping the same manner of investing small amounts of money over time.
Stochastic Oscillator
The Stochastic Oscillator (STOCH) is a momentum indicator, which compares the current price of an asset to the minimum and maximum price of the same asset over a period of time (usually, 14 or 30 days). The formula for calculating STOCH is very simple:
current_price - min_price / max_price - min_price
By giving out a ratio between 0 and 100 (or 0 and 1, depending on how you frame it), STOCH is a simple way of identifying if the market has been oversold(perhaps, time to buy), or overbought (perhaps, time to sell). There are many who believe that the oversold threshold should be 20, and the overbought one around 80.
Of course, using the STOCH indicator alone, will rarely, if ever bring you any significant trading performance. The truth lies in creatively combining STOCHs of different time periods together with other indicators in a model that is versatile against market swings. I would usually use a random forest of multiple shallow decision trees, each using only one or two indicators to classify the available data.
It turns out that while calculating STOCH, I had left an error. Instead of the formula above, it read:
mean_of_price_across_period - min_price / max_price - min_price
I calculated both for a 3-month period of the price Bitcoin/Euro. My version (blue line) seems like a strangely smoothed out version of STOCH (orange line). One would argue that what I have created is just a simple smoothing of the orange line. For comparison, I have added a 14-day simple smoothed out version of the STOCH indicator (the green line). Indeed, the blue and the green lines tend to converge, but not all the time. What makes the blue one even more interesting, is that unlike the fully smoothed-out version, it retains a certain level of detail, without swinging into extremes, the way pure STOCH does.
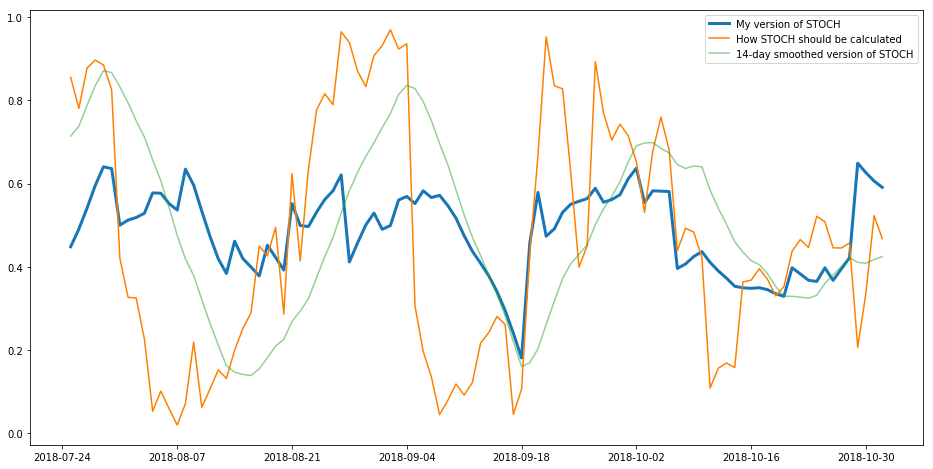
Comparing my version of STOCH with what should be its correct calculation
Trading Performance
I would not have started writing about this, if it weren’t for the interesting trading performance I got from this supposedly “wrong” STOCH indicator. Let’s put this into perspective. I tested four different strategies on the Bitcoin/Euro price starting from Jan 01, 2018. All the strategies involved investing EUR 50 at the beginning of each month, and except DCA (the blue line), all others included selling of Bitcoin at various points and in varying magnitudes. This is what I got:
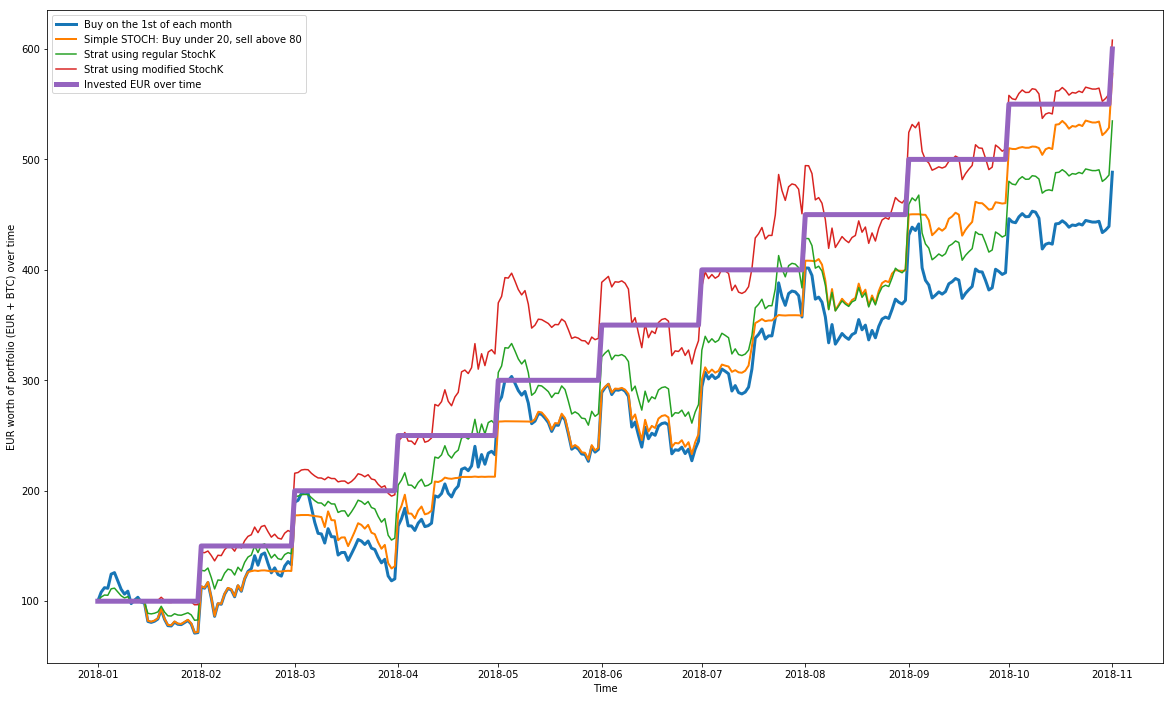
Comparing trading strategy performance: Jan 2018 — Nov 2018
Using the old STOCH rule of thumb — buy under 20, sell above 80 (orange line) does perform a little better than simply buying regularly and holding. In fact, it does perform slightly better even than a random forest ML model that has STOCH as one of its features (the green line). Yet, only in this short bearish period of 11 months. Interestingly enough, the real “winner” seems to be the same version of the random forest strategy, which uses the “wrongly” calculated STOCH. Of all strategies, it is the only one that manages to break even (go above the purple step line), albeit, only by a little.
Dragging the starting point a mere 6 months earlier, right in the middle of the the wild crypto market uprise, shows a completely different picture. Buying and selling using the rule of thumb is nowhere near close. It has remained mostly under the break-even line. The other three strategies pretty much follow the market swings, but the one that really stands out, is the random forest model that uses the variation of STOCH that I thought I’d computed wrongly.
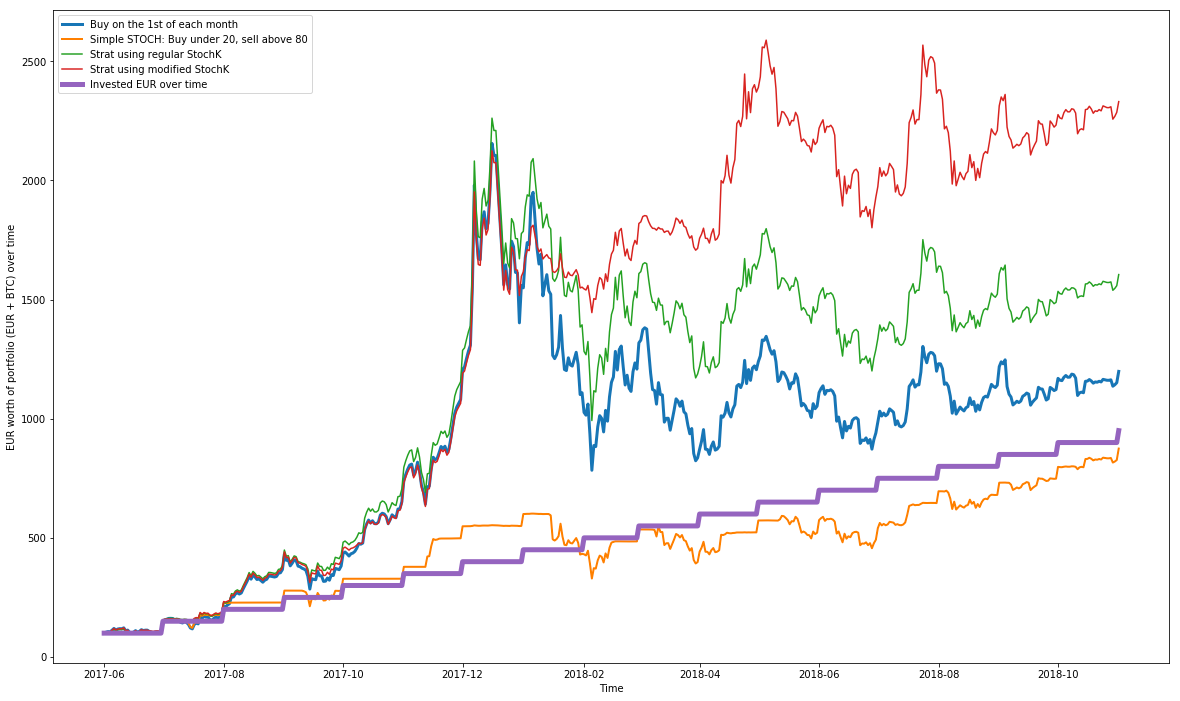
Comparing trading strategy performance: Jun 2017 — Nov 2018
Coincidence? Yet, stretching the start of the trading period as far back as the beginning of 2016would pretty much result int he same picture. By using the modified STOCH as part of my ML model, the strategy has somehow managed to take advantage of the second downfall wave of Bitcoin during February/March of 2018, by selling at the top and re-buying again down at the bottom.
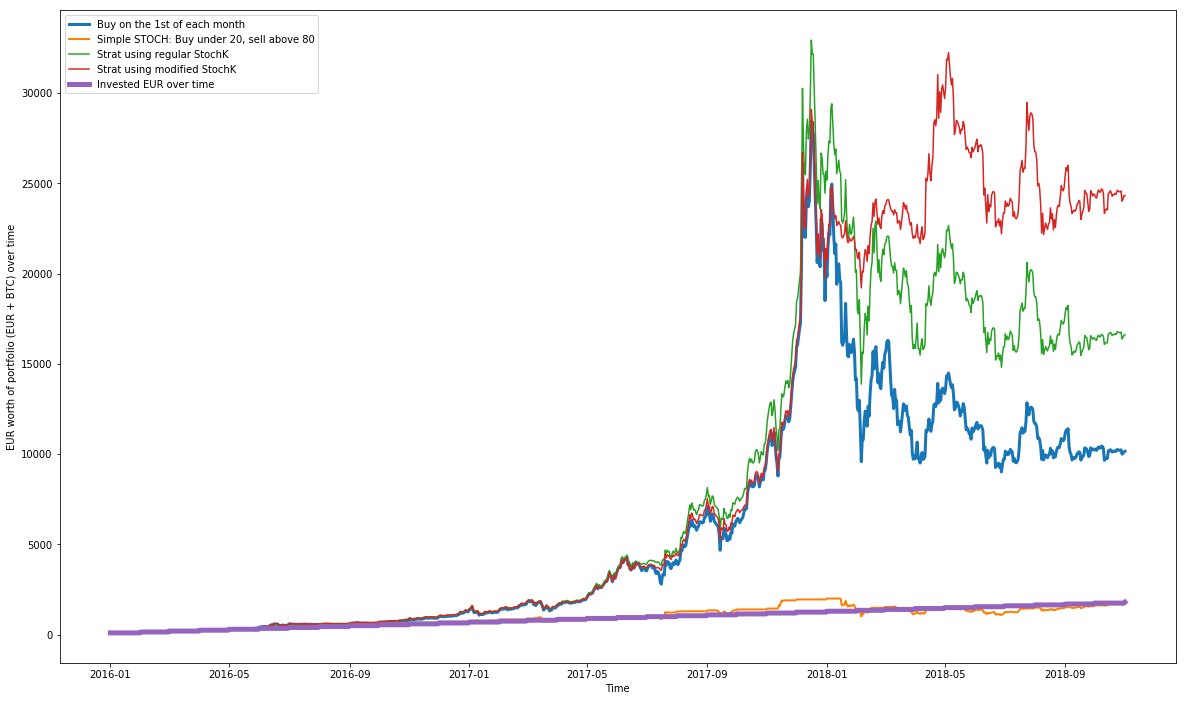
Comparing trading strategy performance: Jan 2016 — Nov 2018
Conclusion
Whether this is a good strategy or not, it is hard for me to judge, based on only the limited data I used. Frankly, as mentioned at the top of the article, its goal is to share some of my learning with the community, and not to give trading advice of any sort.
It seems like I would keep seeing this interpretation of STOCH in future iterations of my strategy. Serendipity plays a huge role in my research, and I will try to break a few more rules of the technical analysis establishment, with the hope that I find some more gems hidden hidden beneath the rocks.

Leave a comment