Whether new to Python, or simply coming from a different domain, the data science enthusiast’s foray into the field can be intimidating. From entering the door, one gets overwhelmed with a bunch of unfamiliar libraries, necessary for one’s daily work: NumPy, SciPy, SciKit, Matplotlib, Pandas, Theano, Tensorflow, Keras, CNTK, just to name a few …
Note: This article is still a work in progress. Feel free to provide feedback and do come back again, to read the final version. (Latest Update: Jan 09th, 2018)
In this article, I am going to list some of the fundamental libraries every data scientist working with Python should know of. I will also provide a human-readable, brief description as to what each of these libraries does, how it is used, and how it fits in the overall picture.
Overview of the Python Data Science Ecosystem
The diagram below creates a map of the libraries, most widely used within the data science and machine learning community:
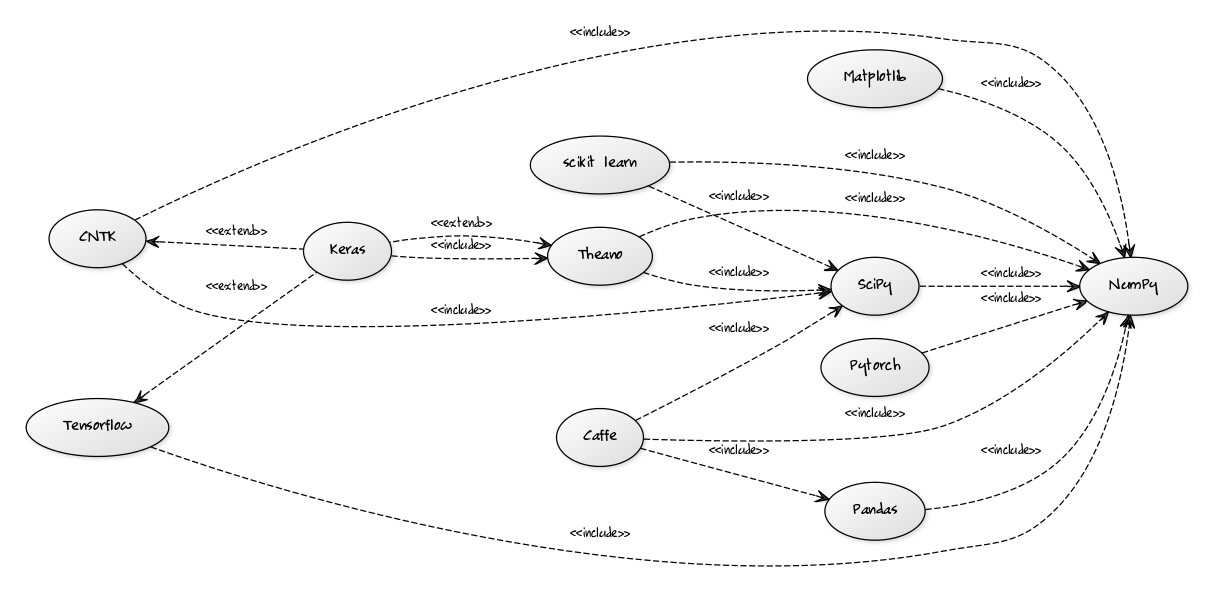
One thing becomes immediately evident from this diagram. In the center of the entire Python data science universe stays one library - NumPy. Its use is so widespread that it has become a de facto standard and a required foundation for pretty much any Python library which contributes to the field. Not surprisingly, it will be the first library we’ll have a look at in our list.
NumPy
NumPy — NumPy is at the bottom of the Python scientific computing ecosystem. It provides powerful N-dimensional array data structures. Unlike a Python list, NumPy’s ndarray is way more memory and CPU-efficient, able to pack billions of data points into a fraction of the memory footprint of a comparable Python list. Less flexible than a Python list, an ndarray is optimised for storing single and double-precision numbers, and executing fast numeric operations on them. NumPy’s ndarray structures are perfectly suitable for storing vector and matrix data. On top, NumPy provides a myriad of statistics and linear algebra functions for handling vector and matrix manipulations, which are extremely fast and with a scientific level of precision. What follows are a few examples, I shamelessly borrowed from a SciPy tutorial. Feel free to check out there rest of them here:
# lots of examples inspired by https://docs.scipy.org/doc/numpy-dev/user/quickstart.html
# you can create an ndarray out of an existing list
a = np.array([2,3,4])

# or multiple dimensions out of lists
b = np.array([[1,2,3], [4,5,6], [7,8,9]])
#array([[1 2 3]
#	      [4 5 6]
#	      [7 8 9]])

# or use one of NumPy's many generator functions, ideal for initialization purposes
# np.zeros(...), np.ones(...), np.random.random(...), np.arange(...) etc
np.zeros( (3,4) )
=> array([[ 0.,  0.,  0.,  0.],
          [ 0.,  0.,  0.,  0.],
          [ 0.,  0.,  0.,  0.]])

np.arange( 0, 2, 0.3 )
=> array([ 0. ,  0.3,  0.6,  0.9,  1.2,  1.5,  1.8])

# you can reshape arrays in whatever ways you like, also slice, iterate, etc
c = np.arange(24).reshape(2,3,4)
=> [[[ 0  1  2  3]
    [ 4  5  6  7]
    [ 8  9 10 11]]
   [[12 13 14 15]
    [16 17 18 19]
    [20 21 22 23]]]

# NumPy also allows fast computations on entire arrays:
a = np.ones((2,3), dtype=int)
a *= 3
=> array([[3, 3, 3],
         [3, 3, 3]])

# and many many more ...
Pandas
NumPy’s strength lies in storing and processing massive amounts of mostly numeric data. This often requires transforming data from third sources (files, databases, etc) into NDArray objects, and after processing is finished, mapping it back to a more human-friendly format easy comprehension and visualizing. This is where Pandas comes on stage. Built on top of the speed and efficiency of NumPy, Pandas brings the concept of DataFrame, a two-dimensional, tabular, and heterogeneous data structure. Extending from NumPy arrays, DataFrame objects in Pandas allow for human-readable column names and indices (row labels), which can be queried upon in the same fashion, and with comparable performance to NumPy.
 Bitcoin price trading data, expressed as a Pandas DataFrame
Code Examples in Pandas
For a great 10-minute intro to Pandas, head over to this page. I have used some of the examples in this tutorial as part of my examples too:
import pandas as pd

# Creating a data frame at it simplest, involves providing the data, the different DataSeries (columns) labels, and an (optional) index
df = pd.DataFrame(np.random.randn(1000, 4), columns=['A', 'B', 'C', 'D'], index=optional_index_integer_sequence_by_default)

# Besides, Pandas provides multiple interfaces for importing data such as CSV, JSON, XML, HDF5 Stores etc
df = pd.read_csv('btc_prices.csv')

# Adding new columns
df['hi_lo_ratio'] = df['high'] / df['low']
df['just_a_scalar_value'] = 42
To be continued …
- Scipy
- Scikit-Learn
- Keras
- TensorFlow
- Theano and many more …
Links and Other Resources
Pandas
10 Minutes to pandas — pandas 0.22.0 documentation Merge and Join DataFrames with Pandas in Python | Shane Lynn

Leave a comment