NOTE: This post is an ongoing collection of tips and tricks I have learned around my work with Pandas. It is a live document, intended to remain in progress forever, as I keep-adding more and more things to it. You can share your personal tips and tricks in the comments below, or on my blog’s subreddit.
The Basics
Selection
Finding a Row Where One of Its Values Is at a Minimum/Maximum
Reducing Output
Often, you will be inspecting extremely large data frames. Usually, when printing out a large data frame, pandas would print out a few rows from start (head) of the frame, followed by a few rows from the end (tail). Though smaller, this representation would still require a bit of scrolling around. Instead of having to spend effort on scrolling, you might as well only request the head or the tail of the data frame respectively:
print(df.head()) # prints a default number of rows (5) from the head
print(df.head(10)) # or you can specify how man yexactly you want to display

# same goes for printing out the end of a data frame
print(df.tail())
print(df.tail(10))
Grouping Data
Obtaining Basic Statistics on Grouped Data at a Glance
When you group a data frame by a given column or a set of columns, a function which comes quite handy is describe(). This example has been provided as part of an Udemy course on data science with Python.
Let’s say we have the following piece of data:
data = {
    'Company': ['GOOG', 'GOOG', 'MSFT', 'MSFT', 'FB', 'FB'],
    'Person': ['Sam', 'Charlie', 'Amy', 'Vanessa', 'Carl', 'Sarah'],
    'Sales': [200, 120, 340, 124, 243, 350]
}

df = pd.DataFrame(data)
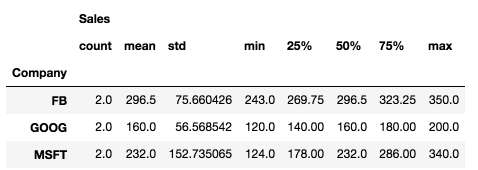
Calling describe() on a group object from this data frame will return some quite useful statistics, without us having to ask for each one individually:
df.groupby('Company').describe()
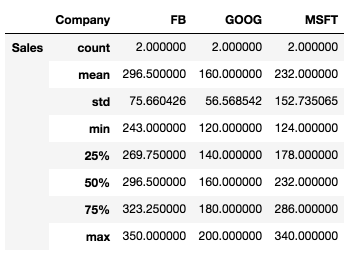
Additionally, we can transpose the data, i.e. shift rows and columns using the transpose() function:
df.groupby('Company').describe().transpose()

Leave a comment